
Graphical Explanation of Filtering
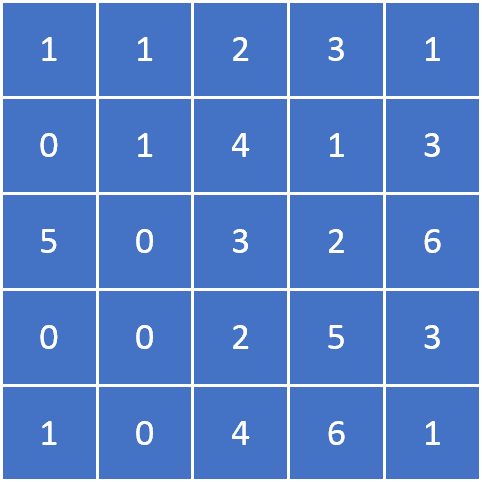
Let us assume we have the following matrix, or image.
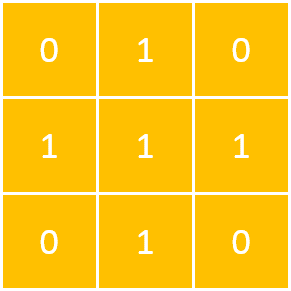
We are interested using this filter on our image.
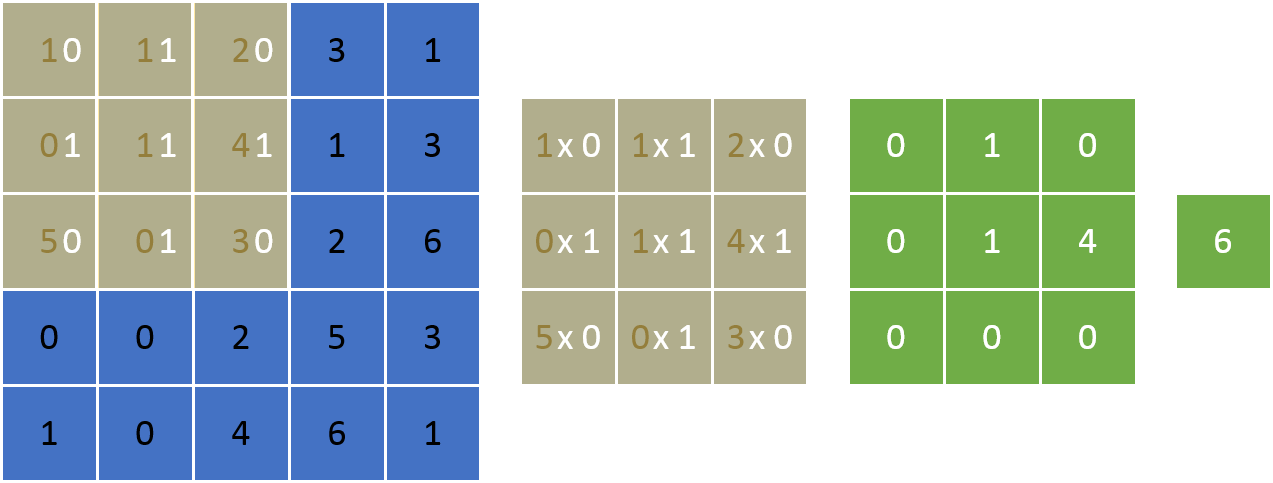
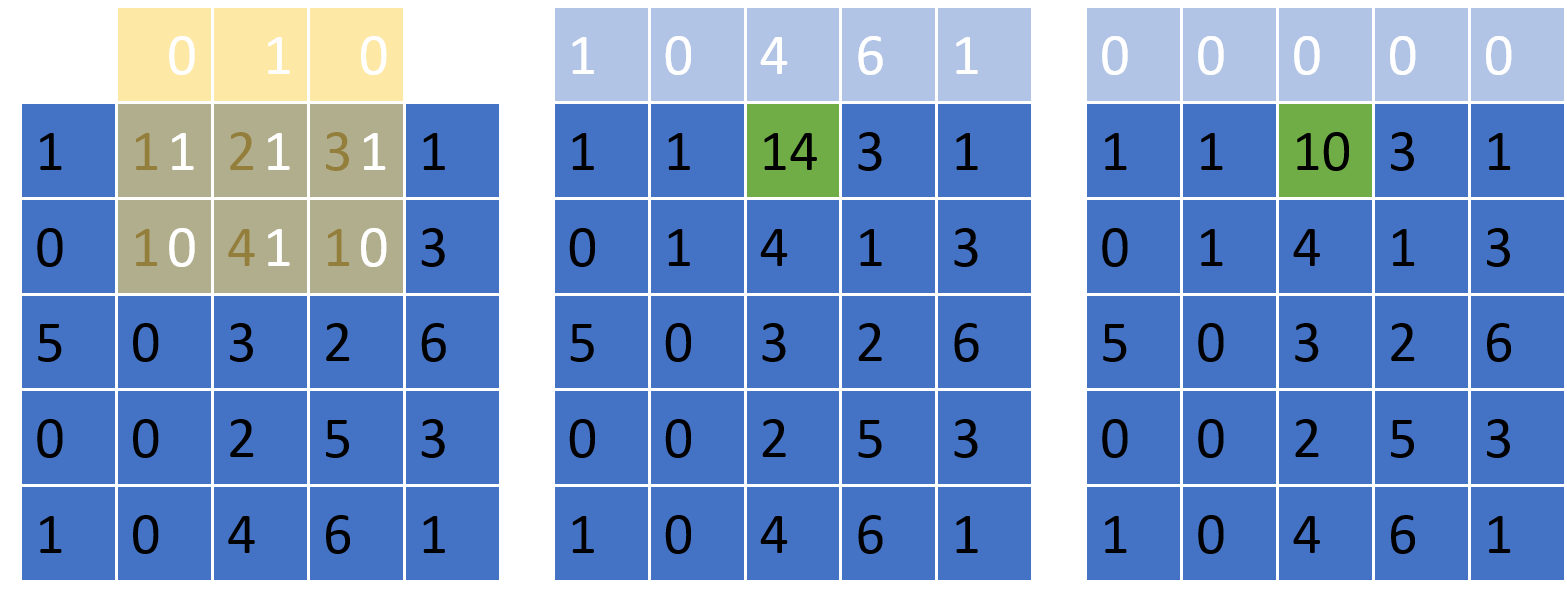
A filter is applied on an image by placing it centered at every possible location on an image, multiplying the values of the filter and the current subsection of the image corresponding to the location of the filter. The multiplied values are then summed up and the resulting value is placed at the pixel the filter was centered on.
Here is a detailed graphic of a single step.
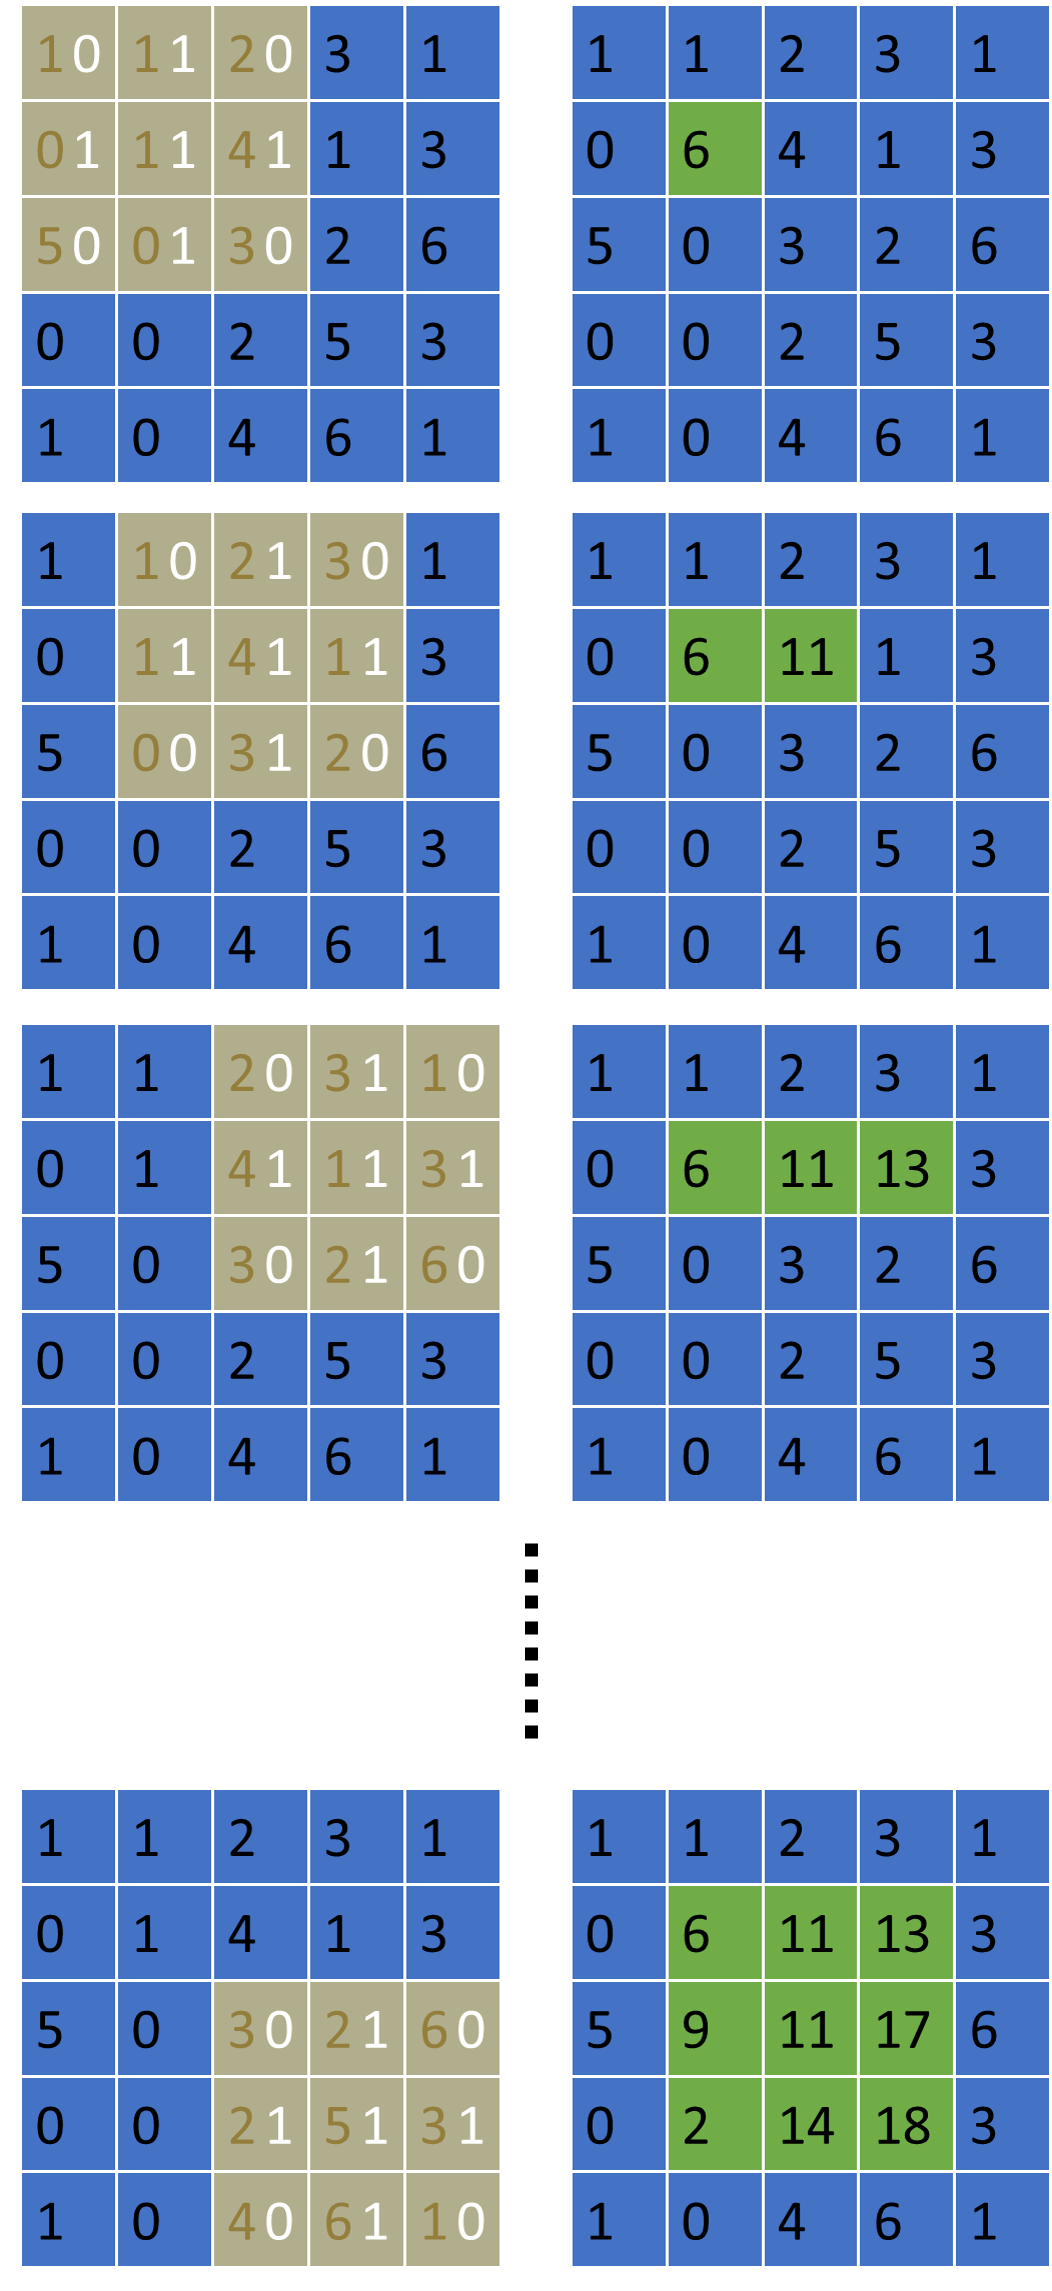
Repeat this for every pixel.
How do we deal with the boundaries? Many ways, but for our purposes, we will either assume that one end of the image is connected to the other (periodic boundary) or there is nothing (zeros) beyond the boundary (non-periodic boundary).
Filtering for 2-Point Statistics
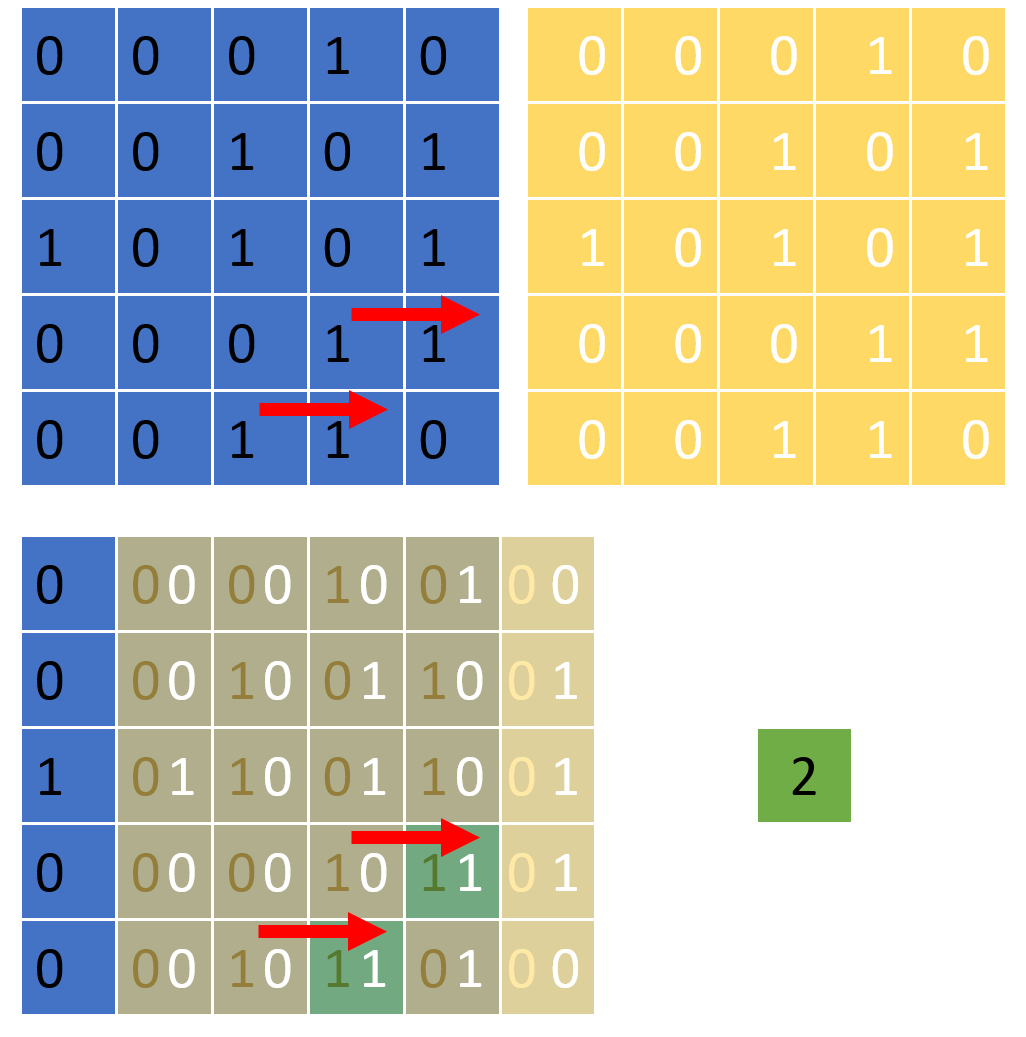
For efficient calculation of 2-point statistics, we use the image itself (phase of interest marked with 1s, all other phases marked with 0s) as both the input and the filter. Graphical examples of how this would work are given below for 2 vectors.
One step.
Another step.
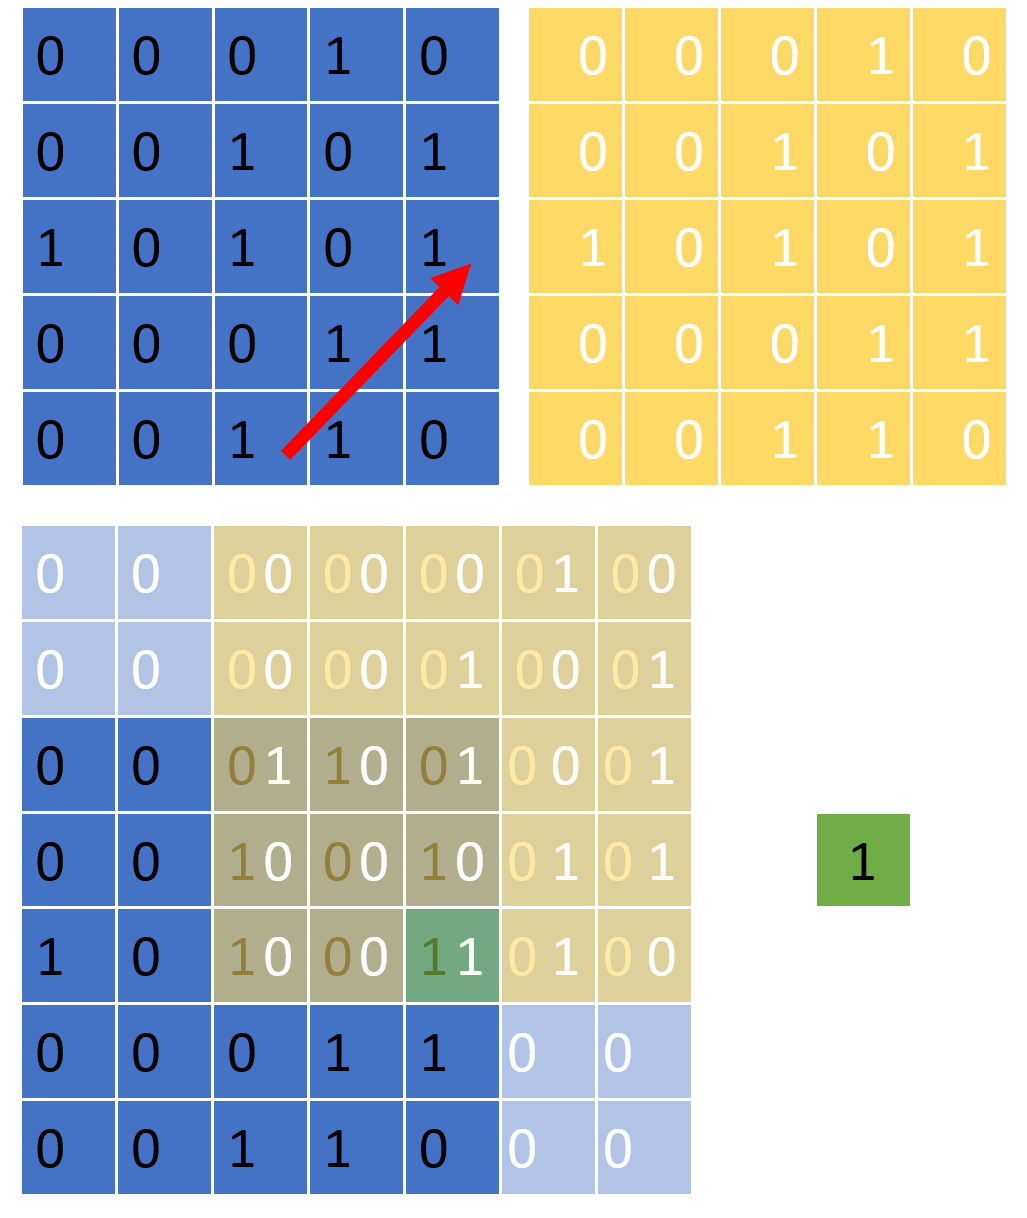
It follows that the resulting matrix will give us the counts of succesful trials in the frequentist definition of 2-point statistics, for each vector. Normalization will yield the actual frequencies.